Metrics
In DeepCube™ Web, the Metrics page charts a metric your services report over the time range you picked. After reading this page you know which metrics you can chart, which choices each one offers, and how to read the chart, the Series table and the notes around them.
Open Metrics under Signals in the navigation. The page follows the time range picker; see Getting around.
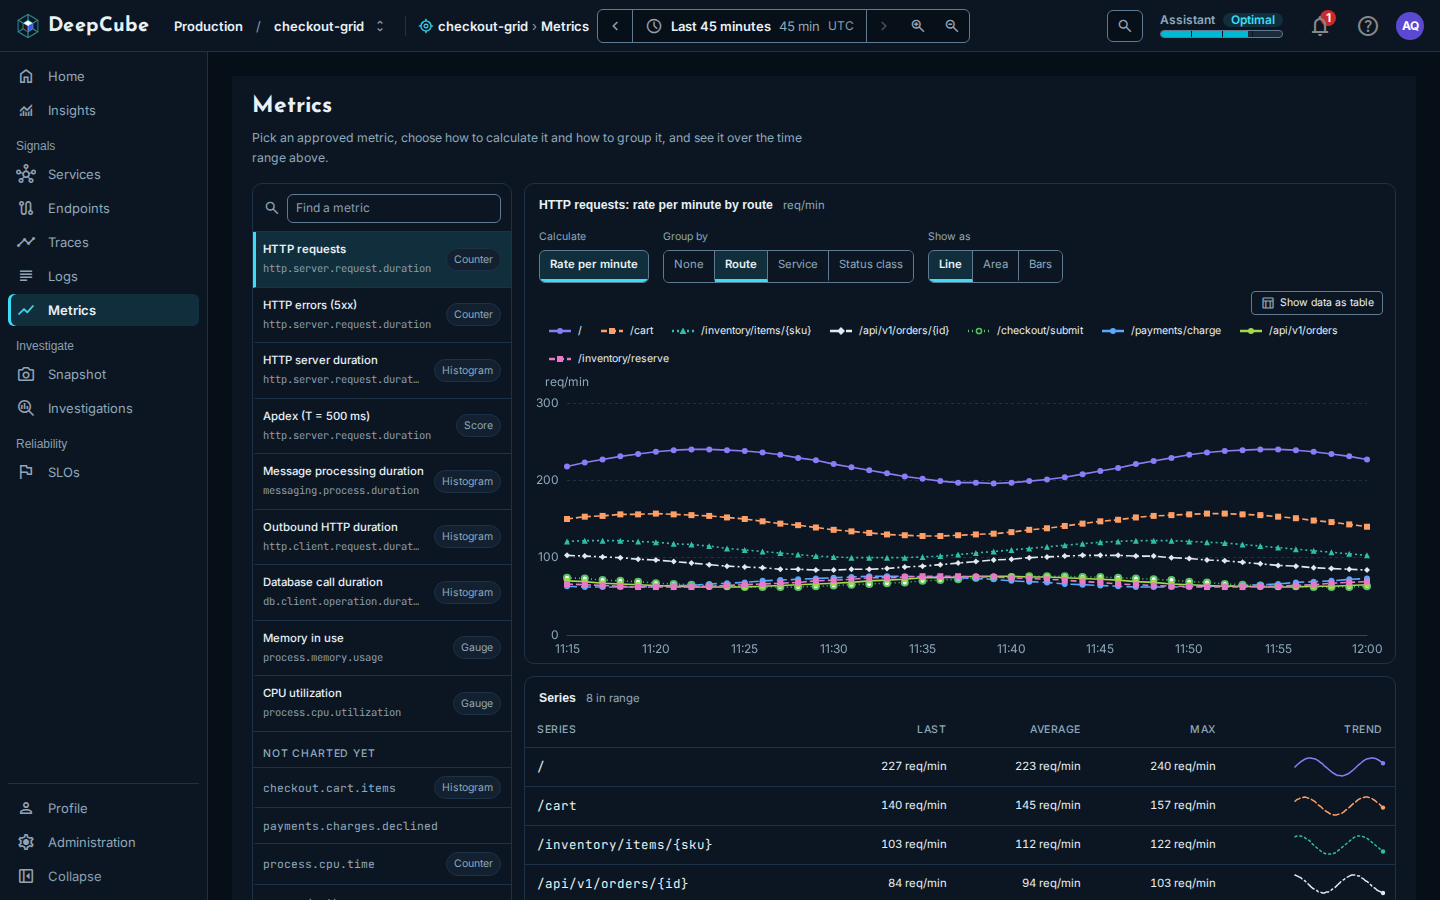
You pick from a fixed set of charts, not a query language
There is no query box. Every chart on this page is a chart the server already defines: the server writes the query and limits it to the grid you are in, so a chart can never read another grid's data. You choose which of those charts to show by picking a metric and then Calculate, Group by and Show as. A combination no chart serves is not offered.
Pick a metric from the catalog
The catalog on the left lists the charted metrics. Each shows its name, the OpenTelemetry instrument the chart reads, and a kind (Counter, Histogram, Gauge or Score). Find a metric searches the names and instrument names.
| Metric | Instrument | Calculate | Group by |
|---|---|---|---|
| HTTP requests | http.server.request.duration | Rate per minute | None, Route, Service, Status class |
| HTTP errors (5xx) | http.server.request.duration | Share of requests | None, Service |
| Per minute | None | ||
| HTTP server duration | http.server.request.duration | p50 | None |
| p90, p95, p99 | None, Service | ||
| Average | Route and status | ||
| Apdex (T = 500 ms) | http.server.request.duration | Score | None, Service |
| Message processing duration | messaging.process.duration | p50, p90, p99 | None |
| Outbound HTTP duration | http.client.request.duration | p50, p90, p99 | None |
| Database call duration | db.client.operation.duration | p50, p90, p99 | None |
| Memory in use | process.memory.usage | Total across instances | None |
| CPU utilization | process.cpu.utilization | Average across instances | None |
Show as offers Line, Area, Bars and Number, as suits the metric:
- The duration metrics offer Line, Bars and Number.
- Apdex (T = 500 ms), Memory in use and CPU utilization offer Line, Area and Number.
- HTTP requests and HTTP errors (5xx) offer all four.
- Number is offered only with Group by set to None, because it shows one value.
When you pick another metric, it starts from its first calculation and grouping, and keeps your Show as and Only service choices when the new chart accepts them.
Narrow a chart to one service
With Group by set to None, Only service narrows the chart to one service. It lists the grid's services (not its dependencies) from the grid graph, which covers at most the last hour of the range. The chosen service is added to the chart's title, for example "HTTP server duration: p90 · payment-service". A grouped chart cannot be narrowed, so Only service is not offered with one.
Your choice is kept in the link
The metric, calculation, grouping, view and service are kept in the page's address. A reload or a shared link opens the same chart. Picking does not add browser history entries, so Back leaves the page.
Example: chart p95 latency for one service
- Open Metrics.
- In the catalog, select HTTP server duration.
- Under Calculate, select p95.
- Leave Group by at None, and choose the service under Only service.
The chart's title names the calculation and the service, for example "HTTP server duration: p95 · payment-service". To compare every service instead, set Group by to Service (Only service is then not offered).
Read the chart and the Series table
The chart's title names your choice, for example "HTTP requests: rate per minute by route", with the unit beside it.
- A chart draws at most the 10 busiest series (highest average first). When there are more, the chart is marked, for example, "Busiest 10 of 14 drawn", and the Series table lists the rest. Use Show data as table on the chart for the values as text.
- Number shows the Latest value, and how the last five values compare with the first five, for example "up 12% across the range, worse". A rise reads as worse for durations, errors, memory and CPU, better for Apdex, and neither for traffic. With fewer than ten values, or when the first five average 0, no comparison is given.
- The Series table lists each series with Last, Average, Max and a Trend line, busiest first, up to 50 rows. When there are more, a note says the table lists the 50 busiest.
A series that reported nothing in the range is left out of both, and a note under the table counts them. A gap in the data is drawn as a gap, never as 0.
An empty chart means nothing was reported
When no service in the grid reported the metric in the range, the chart says No data in this range (Nothing to show in this range in the Number view). For the messaging, outbound HTTP, database, memory and CPU metrics it also names the instrument: these fill in only once a service reports them through the matching OpenTelemetry instrumentation. See Instrument your application.
Not charted yet: what your services report beyond the catalog
Under Not charted yet, the catalog lists the metrics your services reported in the range that no chart in the app reads. They are listed so you can see they arrived, but you cannot chart them on this page.
- A kind is shown when the server knows it: Histogram for any metric whose samples are histograms, Counter or Gauge only for an OpenTelemetry semantic-convention instrument the server recognizes. A metric with no kind beside it is one the server could not classify.
- The note under the catalog gives the counts, for example "9 metrics are charted. Your services reported 14 metrics in this range; 5 are not charted yet and listed above."
- At most 1,000 reported metrics are read, by name. When there are more, the note says only the first 1,000 are listed.
- When the list cannot be loaded, the note says so.